Visualize EEG Spectral Power
Description
This tool allows to generate images of spectral power of EEG signals, channels, and regions of interest (ROIs). Besides, the user can generate images based on the preferred sleep stages, hour, cycle, and the total duration of the sleep.
Steps
1 - Input Files :
Add your EEG spectral power report file (.tsv), which is generated from the Analyze EEG Spectral Power tool.
Select the channels in the “Subject Channel List” or “Cohort Channel List”.
- ROIs :
Add ROIs and select them.
You can create ROIs to group channels with similar labels (e.g., C3-A2, C3-M2, C3) together.
You can choose to analyze either channels or ROIs, or both.
Note
To modify the channel names displayed on the plot, we recommend first using the “Review EEG Spectral Power for the cohort” tool. Customize the names in the generated report, then use that report in this tool for visualization purposes.
- 2 - Group Definition :
Assign a cohort group to each report file. Any cohort group label is accepted.
The number of cohort groups is unlimited.
Warning
If you need to analyze subjects from a single report in two distinct groups, please create two separate report files—one for each group.
- 3 - Output Files :
Define the parameters for generating the images.
Images can be generated at either the group level or the cohort level.
- Group Level: to generate images for each individual group.
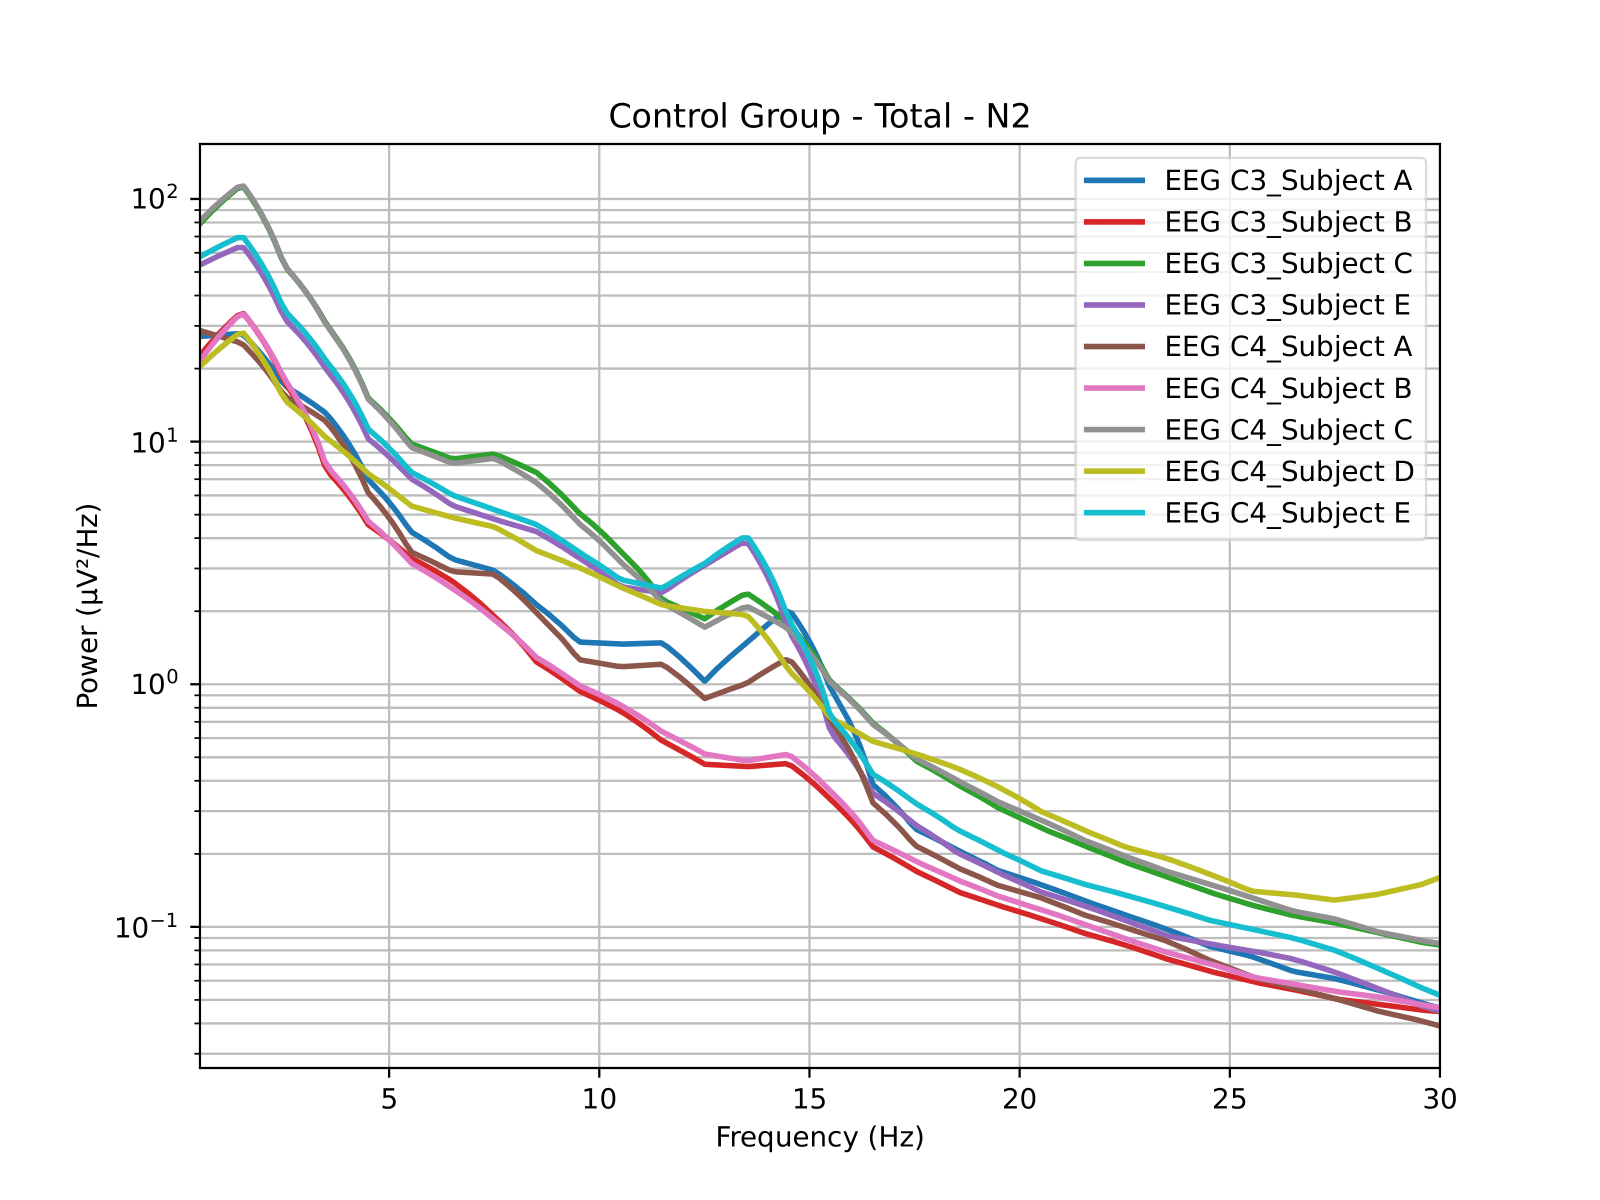
- One picture per group:
All the selected channels or ROIs are illustrated on the same picture.
Example of displaying all of the selected channels:
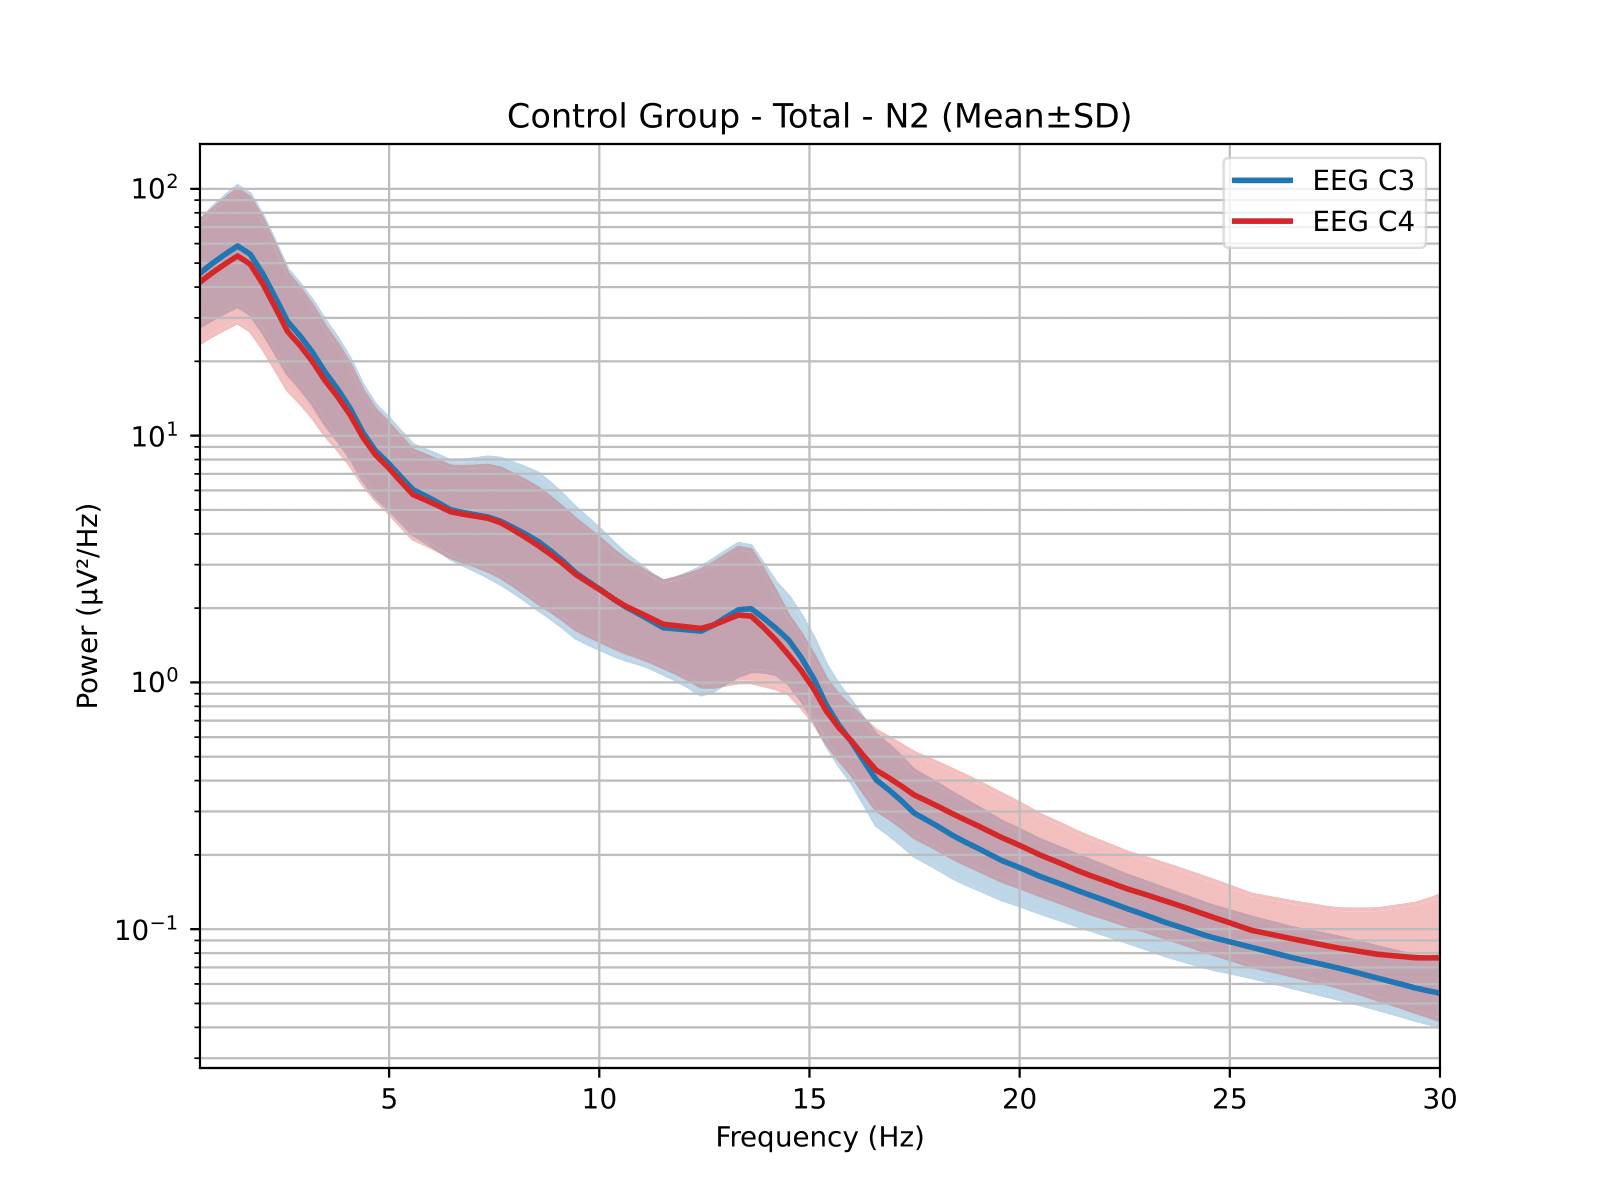
Example of displaying mean and standard deviation of the selected channels:
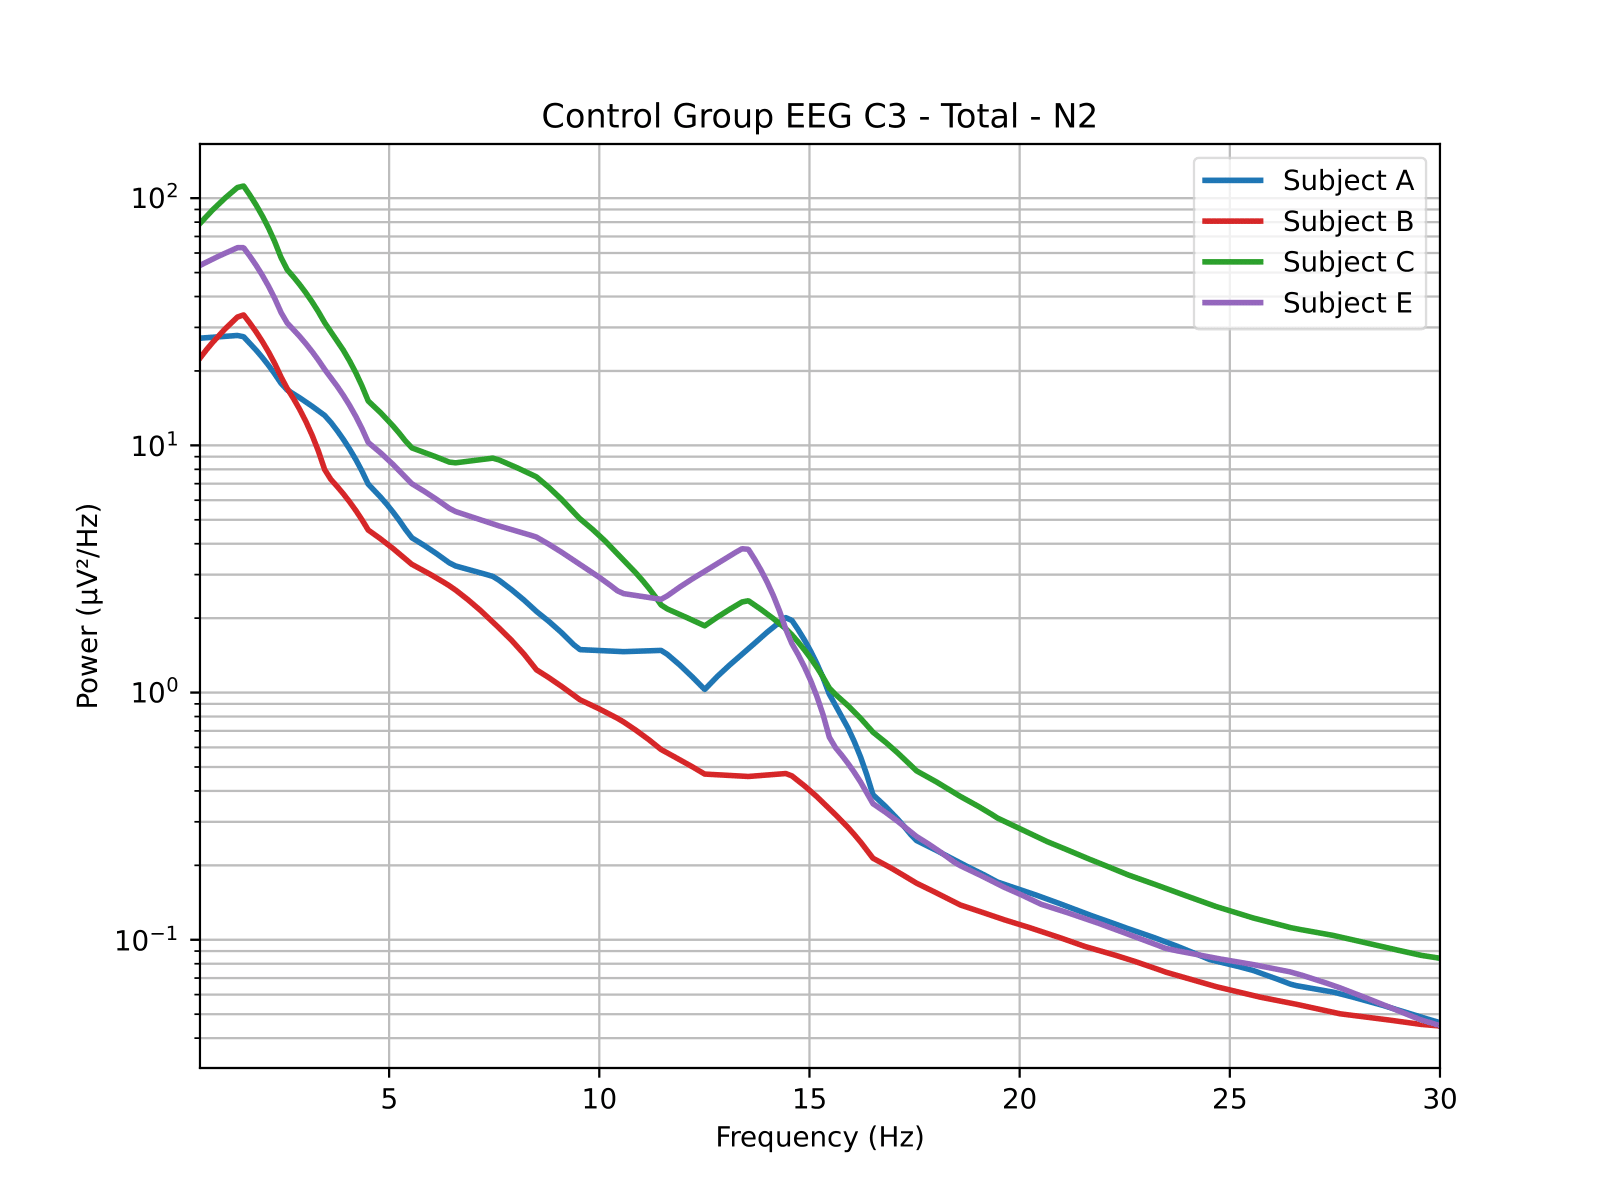
- One picture per channel or ROI per group:
All the subjects in a group are illustrated on the same picture.
Example of displaying all of the subjects for a specific channel:
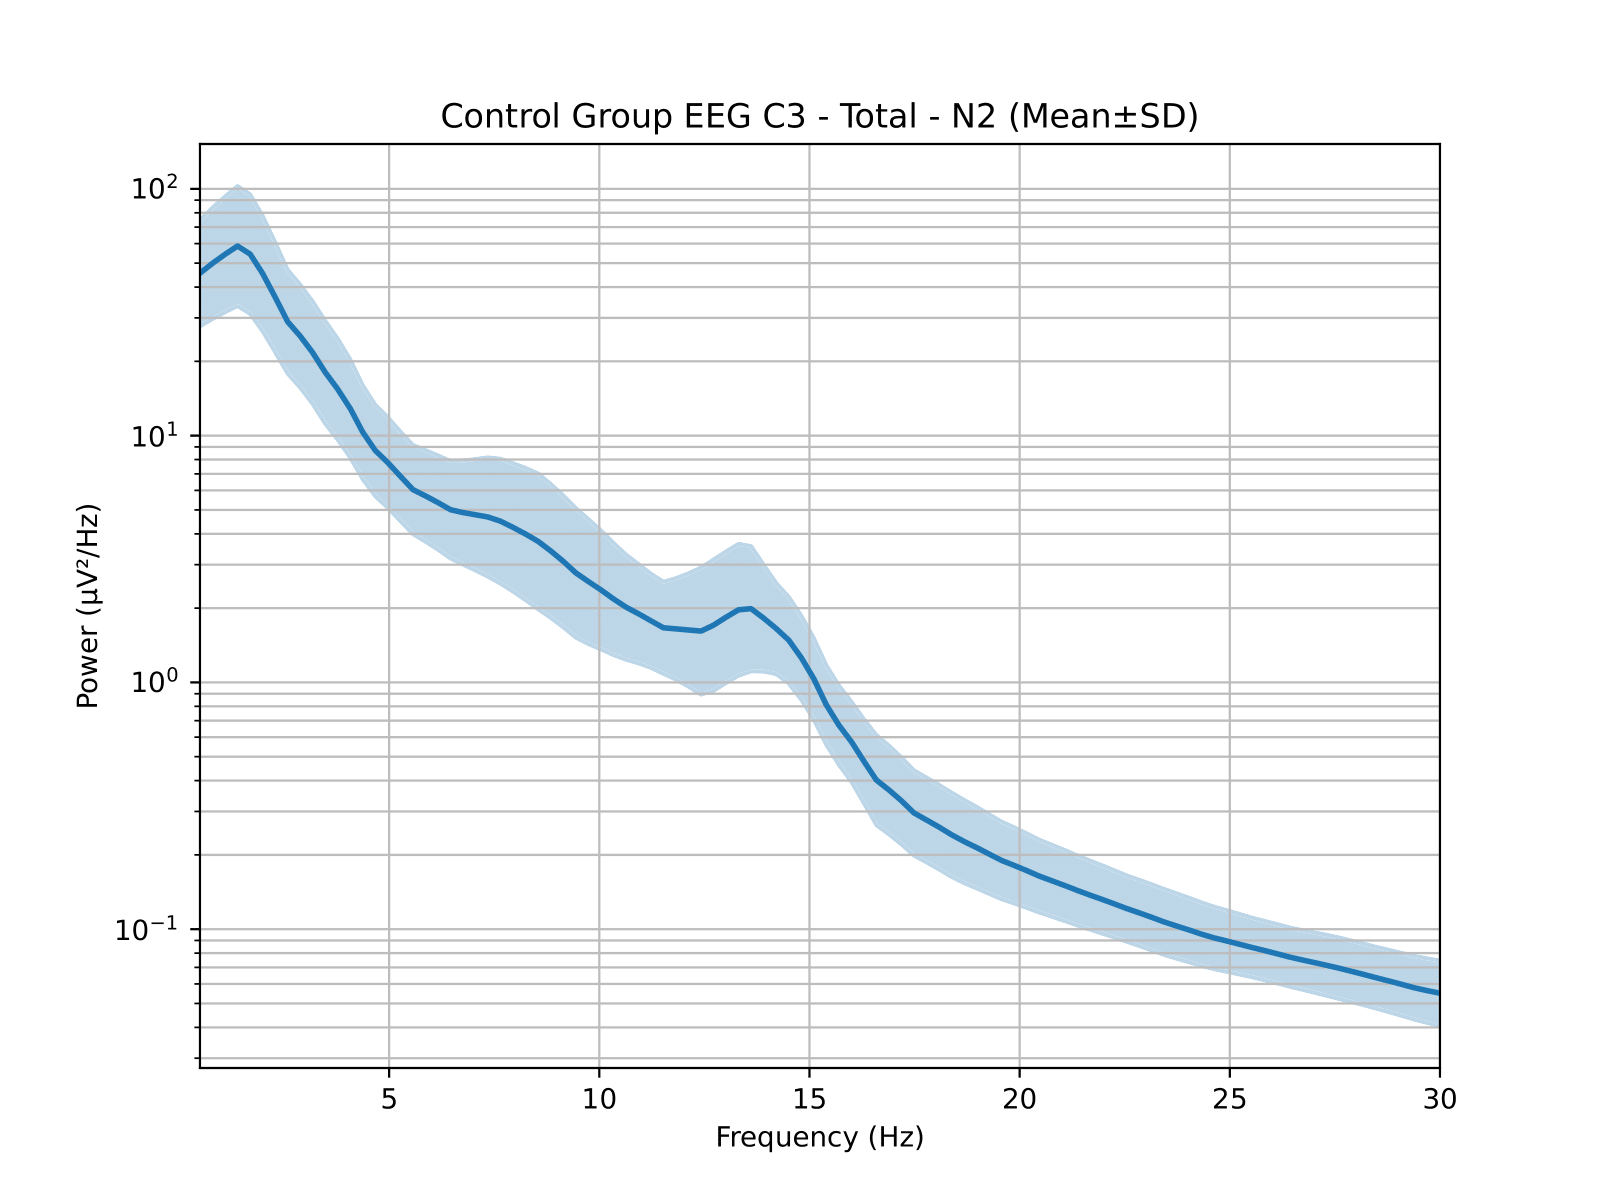
Example of displaying mean and standard deviation of the subjects for a specific channel:
- Cohort Level: to generate pictures for the cohort.
- One picture per cohort:
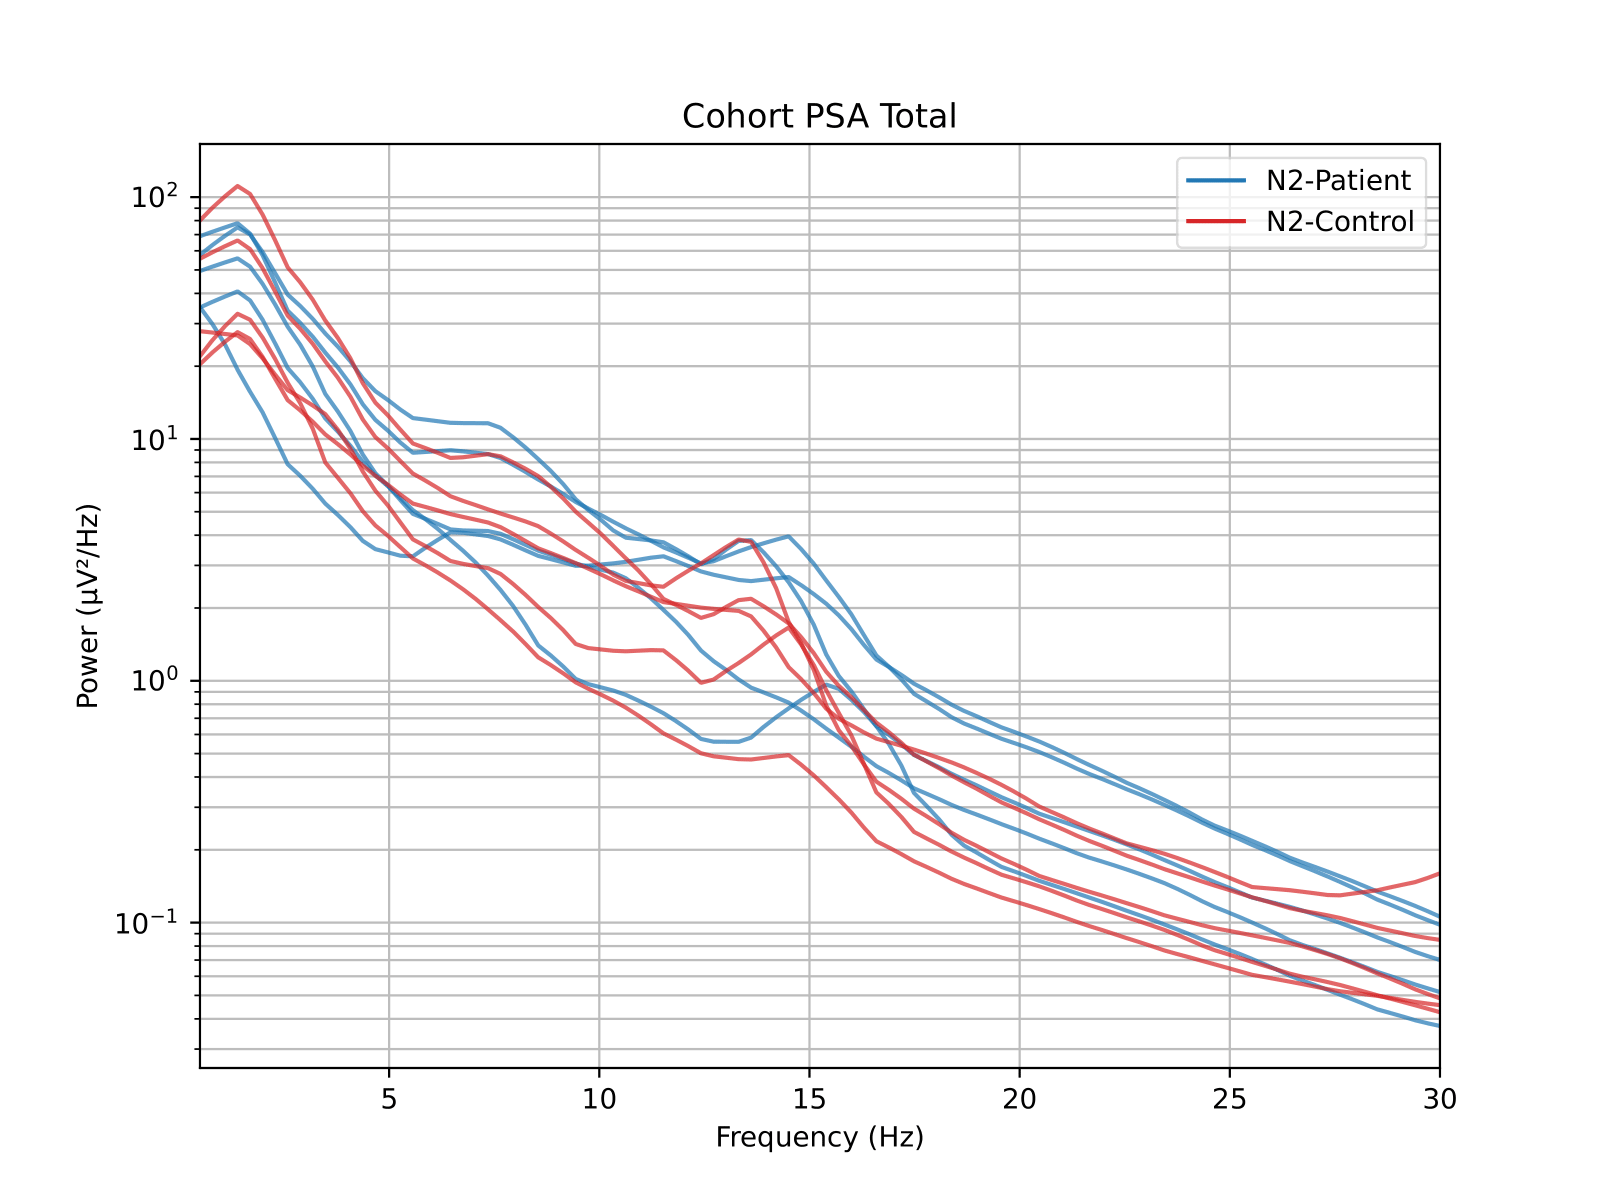
PSA averaged across channels per group of subjects. Each PSA curve represents the signal averaged across all the selected channels or ROIs for a group of subjects.
Example of displaying all of the subjects in a cohort:
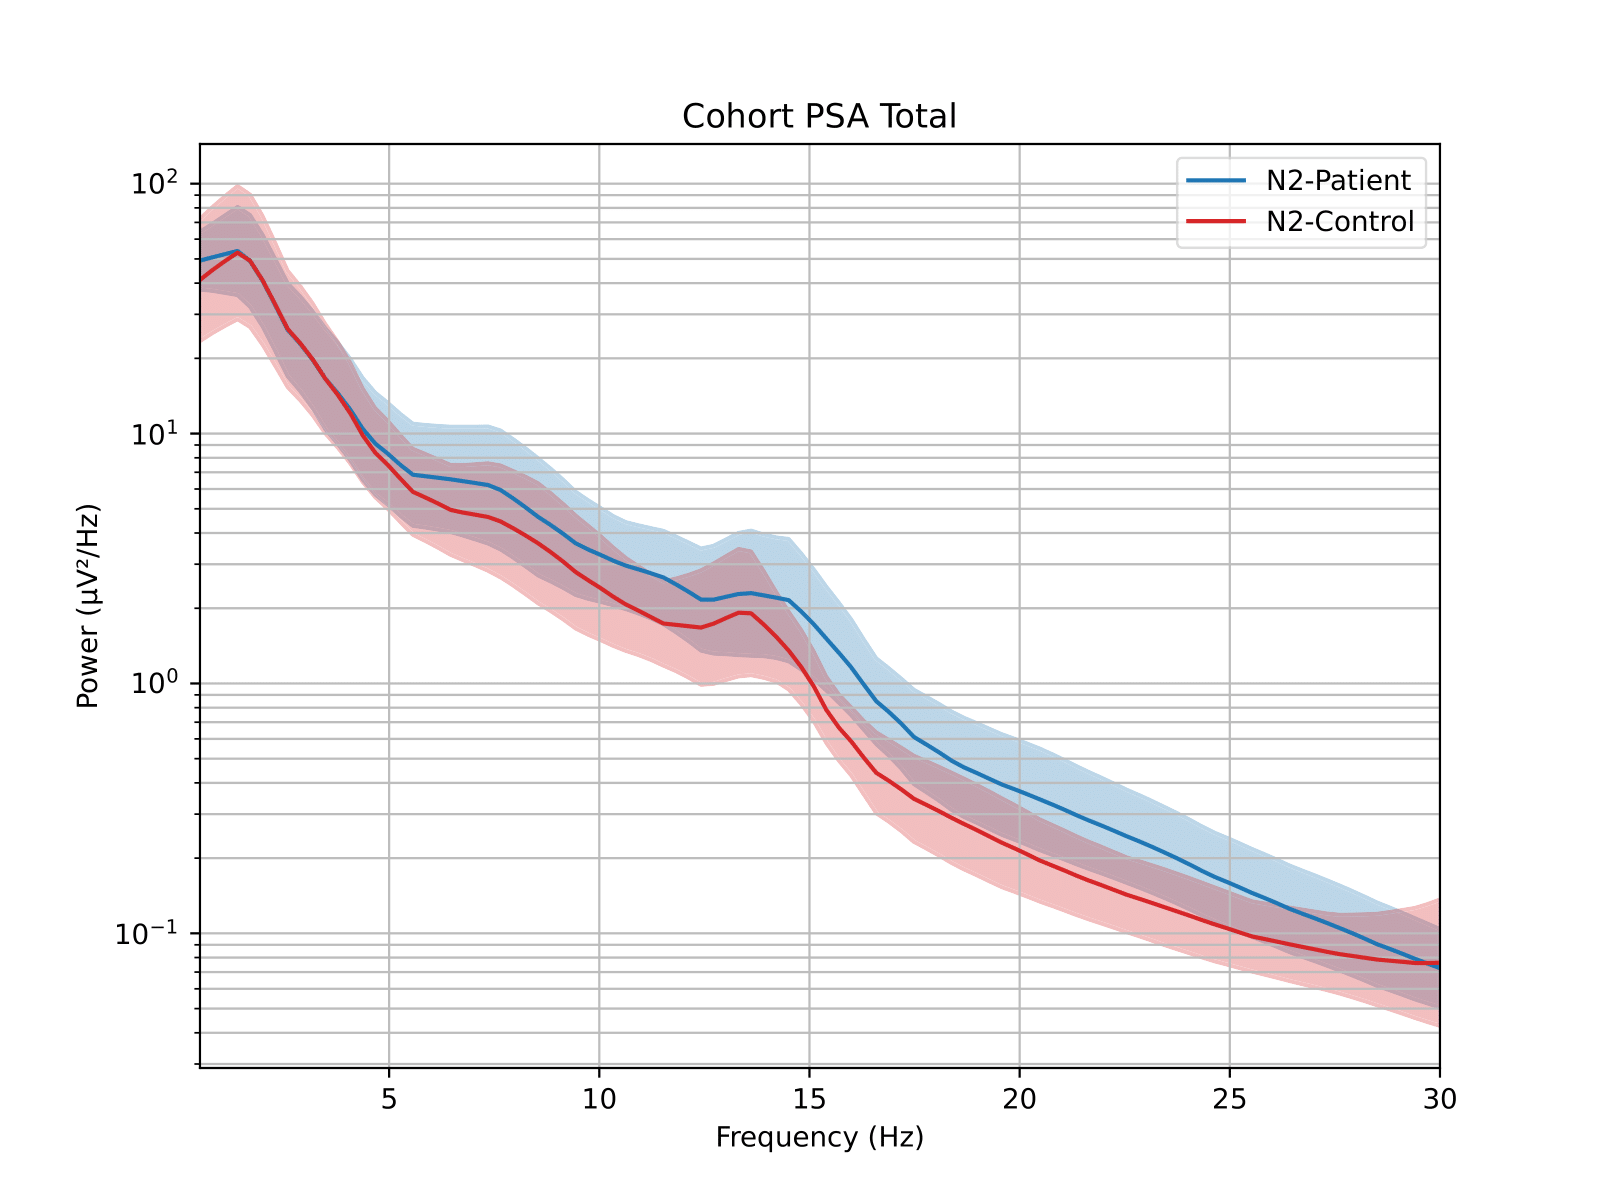
Example of displaying mean and standard deviation of the subjects in a cohort:
- One picture per channel or ROI:
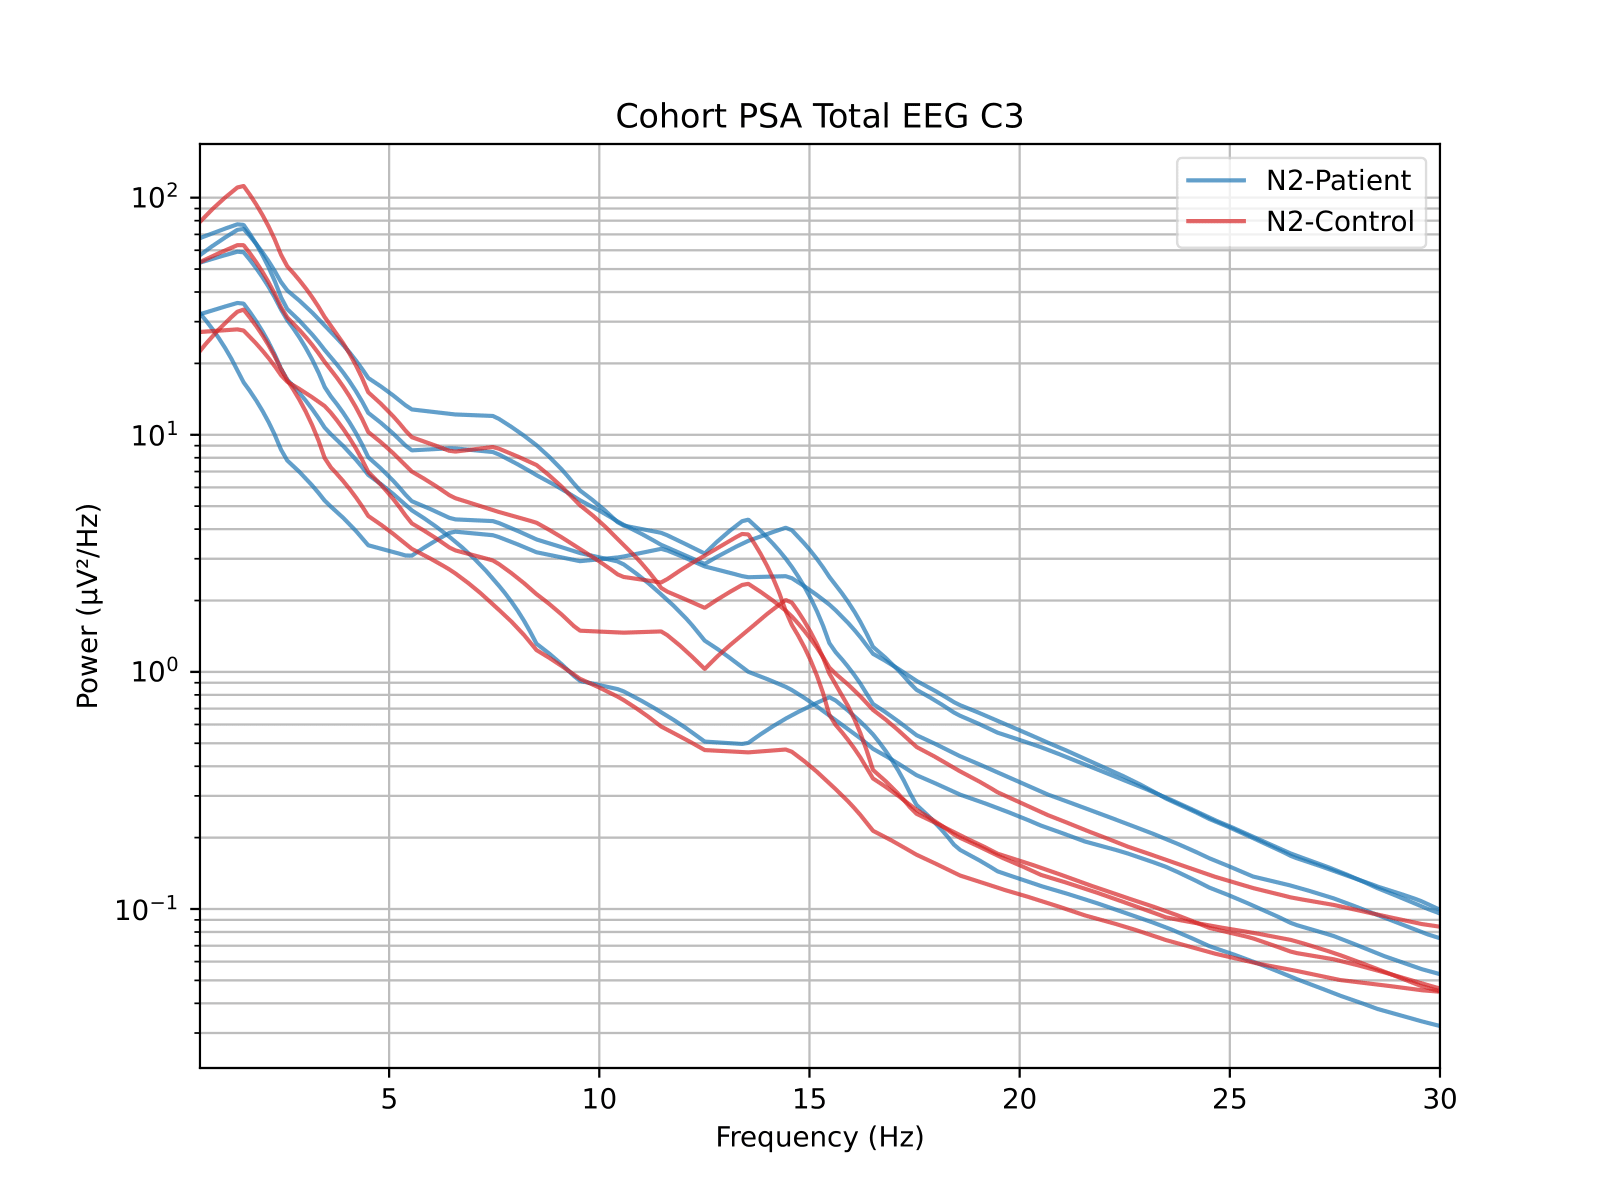
PSA per channel per group of subjects. Each PSA curve represents the signal for a selected channel or ROI for a group of subjects.
Example of displaying all of the subjects for a specific channel in a cohort:
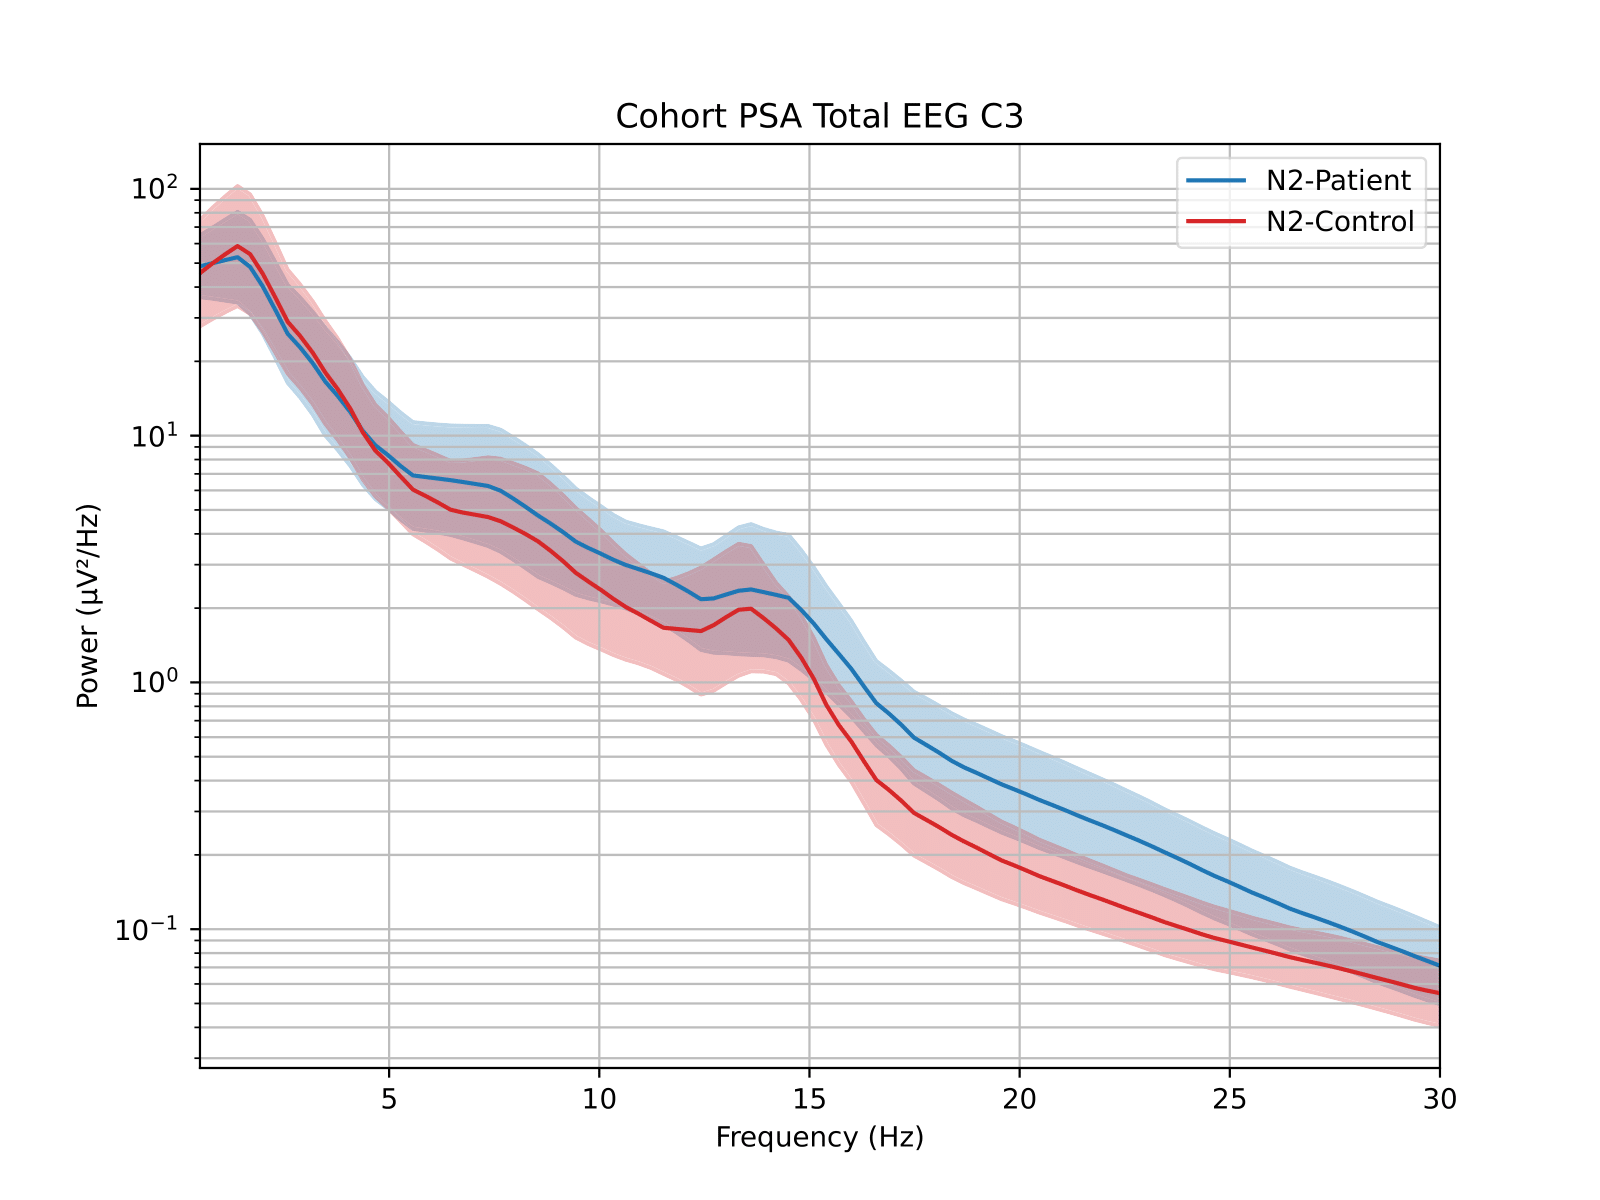
Example of displaying mean and standard deviation of the subjects for a specific channel in a cohort:
Select the prefered sleep stages, and section to display the EEG spectral power images.
Specify desired display options, such as plotting the mean and standard deviation EEG signal spectral power curve and setting axis limits. (For more options look at the “Colors” settings page in the left panel).
Select the output folder to save the images.
Version History
- v2.0.1Distributed with CEAMS package version 7.3.0 — Snooz beta 3.0.0
The title of the figures has been removed to allow more flexibility for the users.
Some parameter names have been changed internally to be clearer for developers, leading to an increase in the tool’s version number.
- v2.0.0Distributed with CEAMS package version 7.3.0 — Snooz beta 3.0.0
Initial release of the tool.